Do Korean Stocks Follow US Stocks? We Measured 17 Pairs
When Micron rises in New York, SK hynix usually opens higher in Seoul a few hours later. Anyone who watches both markets has seen it. If you hold SK hynix, the useful question is how strong the link is, which stocks have it, and whether any of it is left once Seoul has opened.
We measured it for 17 pairs of Korean and US stocks over about 18 months, day by day and week by week.
Memory chips have the strongest link. Within a day it shows up in the opening price, and we found little of it afterward. Over a week the two move together closely, yet we found no sign that one week's US move carries into the next week in Seoul.
How we measured it
The order of the two sessions matters for anyone trading on US news. Seoul opens at 9:00 am, three to four hours after New York closes, so a US move first reaches the regular session at the next open.
For each pair we took the US stock's daily change and matched it with the next Seoul session, 361 sessions from May 2025 to November 10, 2026. Then we split the Korean stock's day in two:
- Opening gap: previous close to the 9:00 am opening price
- Open to close: opening price to that day's close
A correlation of +1 means two series always move together; 0 means no relationship.
The link shows up at the open
SK hynix's opening gap had a correlation of +0.67 with Micron's move the day before. From the open to the close, the correlation was −0.07.
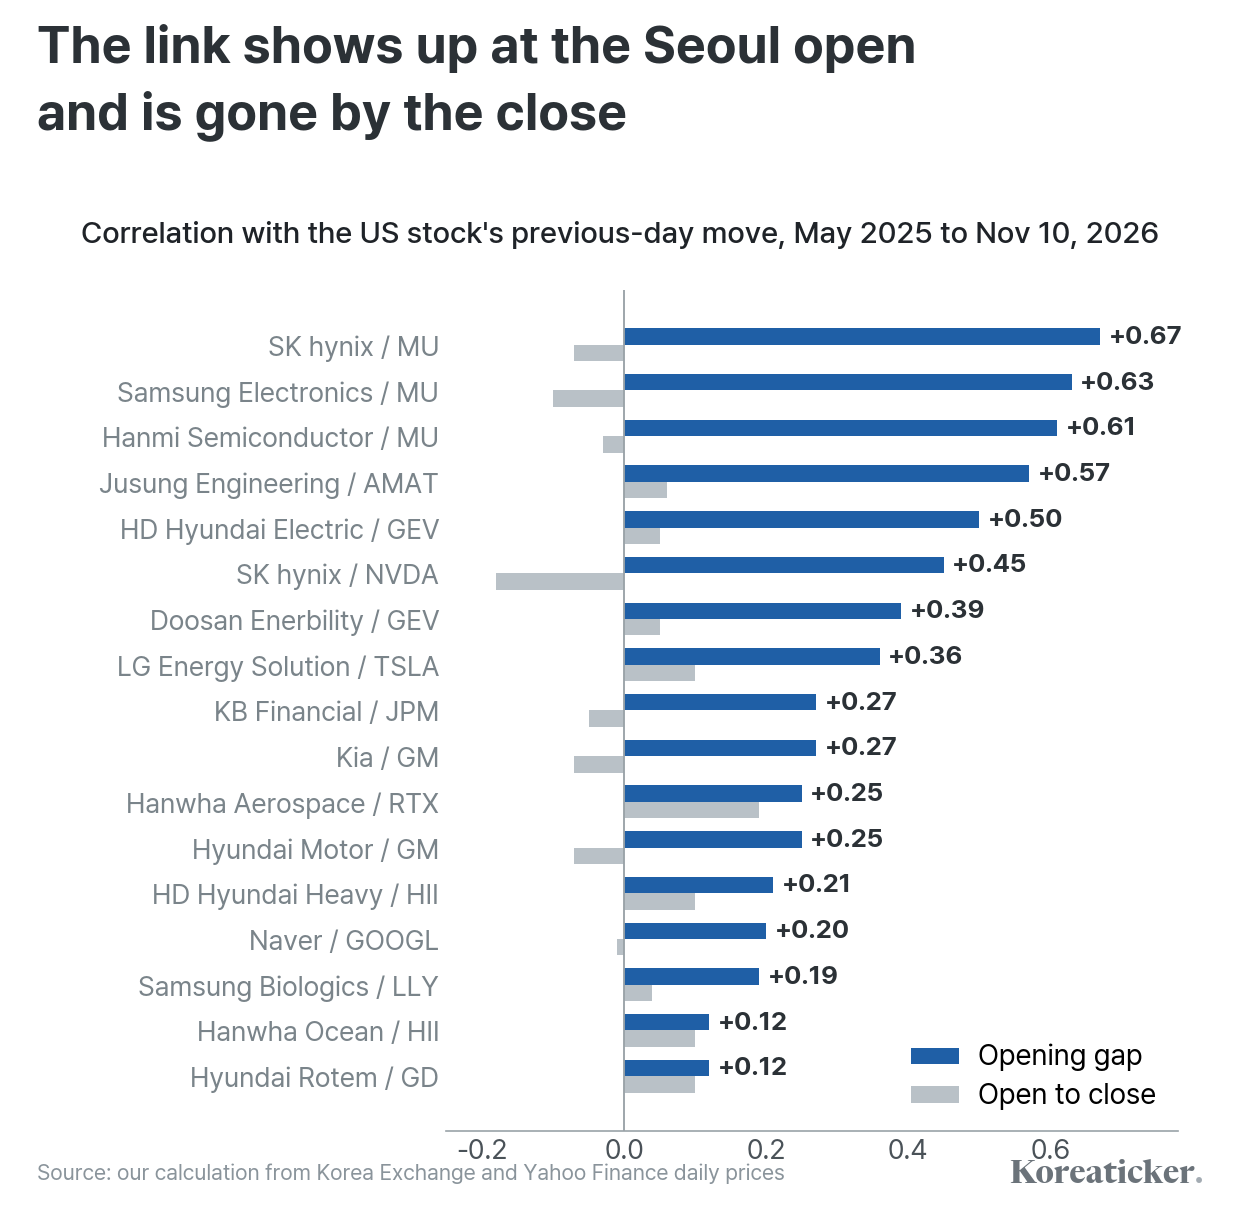
Every pair has a positive correlation at the open. From open to close, the figures sit between −0.18 and +0.19. Splitting the period into two halves gave similar results for the chip pairs: +0.70 and +0.67 for SK hynix and Micron.
If you check Micron's close before deciding on SK hynix, by the time you can act in the regular session, the part we could measure is already in the opening price.
Chips follow chips. Most others follow the US market
| Korean stock / US stock | Industry | Opening gap vs US peer | Opening gap vs S&P 500 ETF |
|---|---|---|---|
| SK hynix / Micron | Memory chips | +0.67 | +0.53 |
| Samsung Electronics / Micron | Memory chips | +0.63 | +0.54 |
| Hanmi Semiconductor / Micron | Chip equipment | +0.61 | +0.57 |
| Jusung Engineering / Applied Materials | Chip equipment | +0.57 | +0.54 |
| HD Hyundai Electric / GE Vernova | Power equipment | +0.50 | +0.59 |
| LG Energy Solution / Tesla | Batteries | +0.36 | +0.44 |
| Hanwha Aerospace / RTX | Defense | +0.25 | +0.24 |
| Hyundai Motor / General Motors | Autos | +0.25 | +0.54 |
| HD Hyundai Heavy / Huntington Ingalls | Shipbuilding | +0.21 | +0.42 |
| Naver / Alphabet | Internet | +0.20 | +0.47 |
The last column is the same calculation against SPY, the S&P 500 ETF, as a baseline. Against it, the memory makers stand out. SK hynix and Samsung Electronics tracked Micron more closely than they tracked the US market.
For Hyundai Motor, Naver and the shipbuilders it was the other way around: the opening gap was tied more closely to the US market than to the US company in the same industry, so for their holders the S&P 500's day lined up better with the next Seoul open. Defense stocks had the weakest tie to either.
What is left after the open
On the 35 days Micron fell 5% or more, SK hynix opened 4.3% lower on average. From there to the close it rose 0.3% on average.
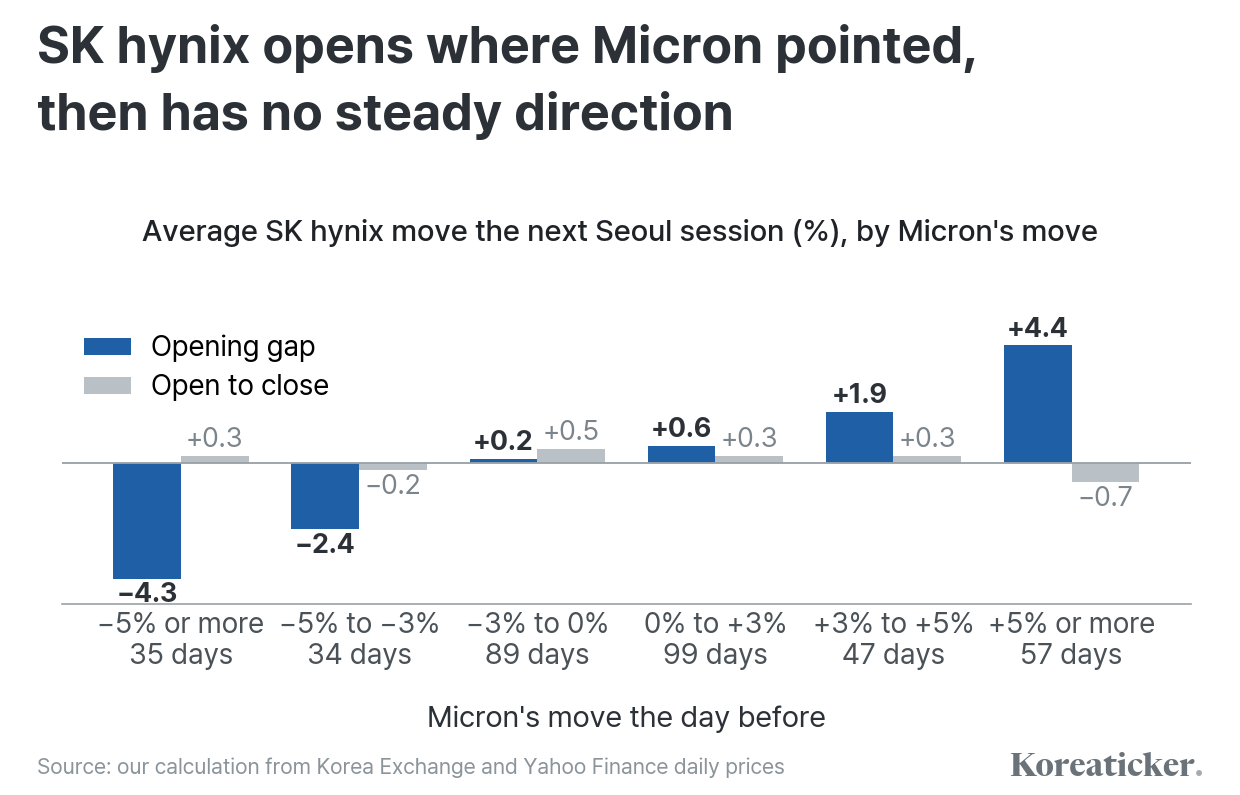
The opening gap grew with the size of Micron's move. After the open the averages are small and change sign from one group to the next, which is consistent with the overnight news being in the price by 9:00 am, though averages cannot prove it.
On the 173 days when Micron moved 3% or more, SK hynix closed the next session in the same direction 76% of the time. Measured from the opening price, that falls to 49%, about a coin flip. Someone buying at the open after such a move was buying after the gap.
Micron holders see the same pattern in the other direction, only weaker. SK hynix's move in Seoul had a correlation of +0.48 with Micron's opening gap that evening and +0.01 with Micron's move from open to close.
Over a week: together, with no head start
Weekly changes in SK hynix and Micron had a correlation of +0.72. Micron's change in one week and SK hynix's change in the following week: +0.08.
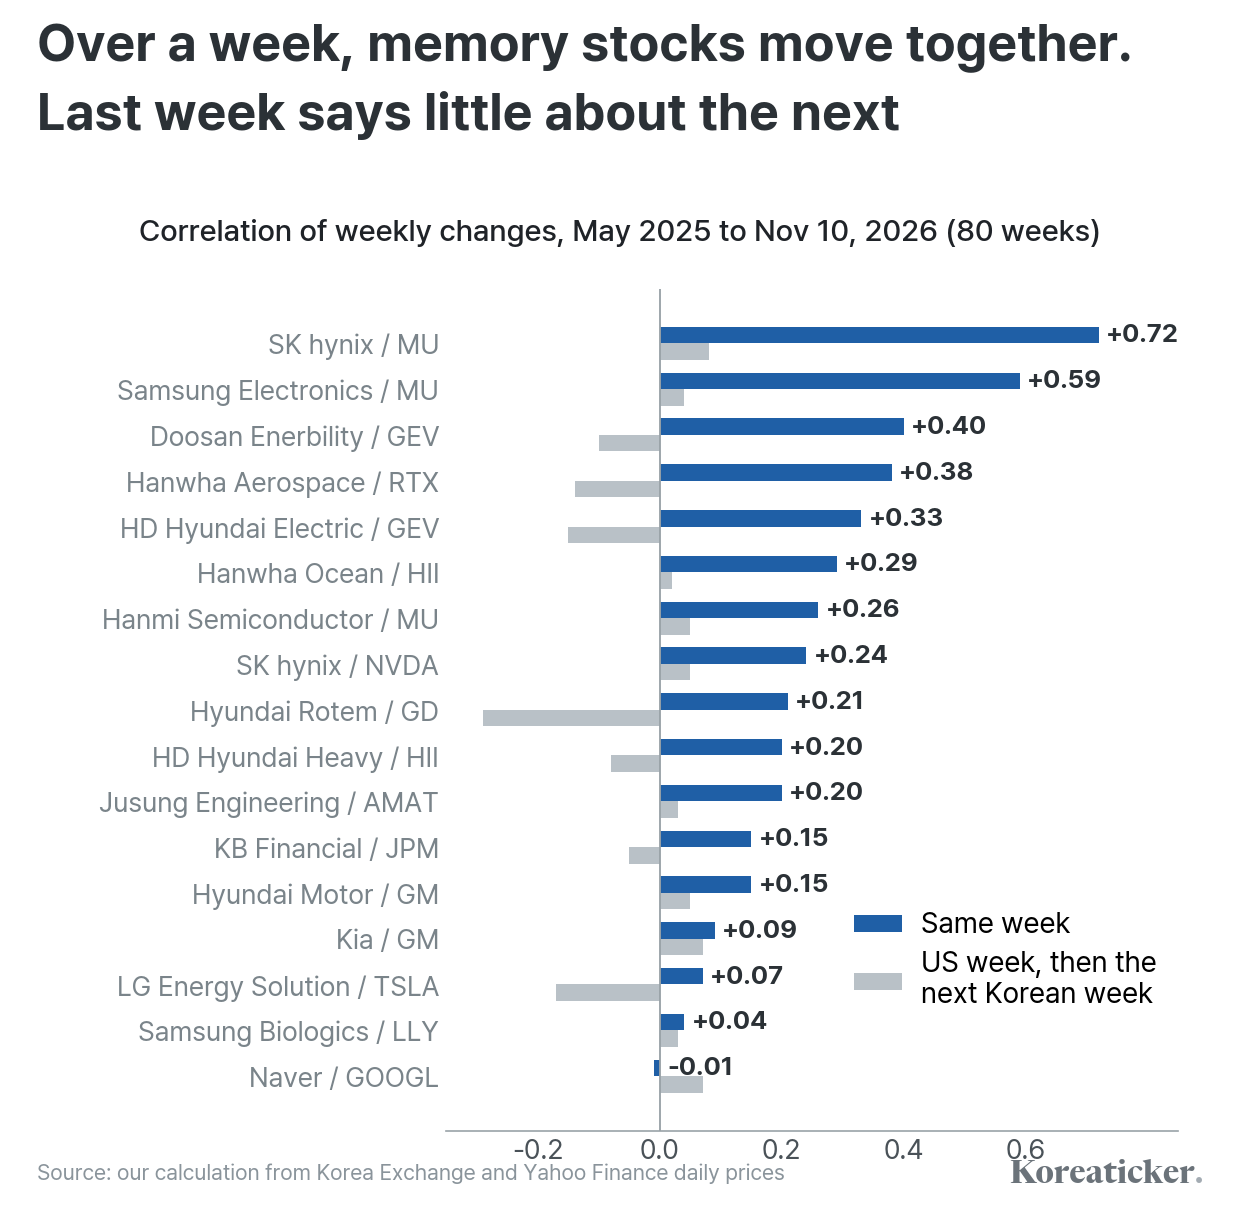
The US week is cut off at the last New York close before Seoul's final session of the week, so that no US move is counted as "next week."
Over a week the memory makers moved with Micron more tightly than day to day: +0.72 for SK hynix and +0.59 for Samsung Electronics. Outside memory, no pair in our sample was above +0.40.
Owning Micron and SK hynix puts the money in two countries, yet the two moved largely together week to week. A bad week for one was usually a bad week for the other.
The gray bars test for a lead, comparing the US stock's week with the Korean stock's following week. They range from −0.29 to +0.08. With 80 weeks of data and many pairs tested, we did not find a lead that held up in this sample, though a weak one cannot be ruled out.
A wider search: 5,355 pairs
Our 17 pairs were chosen by us, so we ran the weekly test on 85 large Korean stocks against 63 US stocks and ETFs to see whether a holder of some other Korean stock has a US stock worth watching.
| Korean stock / US stock | Link | Same-week correlation |
|---|---|---|
| SK hynix / Micron | Memory chips | +0.72 |
| SK Square / Micron | SK hynix's largest shareholder | +0.69 |
| SK hynix / Lam Research | Chipmaker and equipment supplier | +0.64 |
| Samsung Electronics / TSMC (ADR) | Chipmakers | +0.63 |
| PSK / Lam Research | Chip equipment | +0.57 |
| Korea Zinc / gold ETF (GLD) | Metals refiner and the gold price | +0.55 |
| Korean Air / Delta Air Lines | Airlines | +0.53 |
Each was above +0.40 in both halves of the period. Nearly all of the strongest pairs were in chips; gold and airlines were the exceptions. An SK Square holder, for one, saw weekly moves that tracked Micron's closely. The 85 stocks are today's largest, so companies that shrank or delisted during the period are not in the test.
We also asked which pairs showed the US stock leading the Korean stock by a week, with a correlation of at least 0.2 and the same sign in both halves. Of 5,355 pairs, 152 passed, and the strongest had no visible business connection, such as an insurer and a carmaker.
When we misaligned the US data by 7, 13, 19 and 26 weeks, which breaks any true link, 77 to 145 pairs still passed. It is a rough check, but a pair passing this screen is not a trading signal by itself. Each stock appears in many pairs, so the 152 are not independent findings.
Limits of this test
- Who can act on the daily gap: the gap happens while Seoul's regular session is closed. Someone who sees Micron's close and buys SK hynix at the 9:00 am open is buying after the gap. In our sample, the average move from that opening price to the close was small in either direction
- What we did not test: prices inside the day, Korea's pre-market session, trading costs or currency moves. Daily data cannot show what happens in the first minutes
- How far it generalizes: 18 months, or 80 weeks, is a short period and included an unusually volatile 2026. Correlations change, and 17 pairs chosen by us are a sample, not the market
The around-the-clock contracts described in Korean stocks now trade 24/7 on crypto exchanges trade through that overnight gap.
For US investors
How to buy the stocks in this article
Sources and notes
- Korea Exchange daily prices (regular-session open and close) for 16 Korean stocks, May 2025 to November 10, 2026
- Yahoo Finance daily prices for Micron, Nvidia, Applied Materials, GE Vernova, Tesla, General Motors, RTX, General Dynamics, Huntington Ingalls, Alphabet, JPMorgan, Eli Lilly and SPY, dated in New York time
- Korea Exchange trading hours. global.krx.co.kr
Method: each US daily change (close to close) is matched with the first Seoul session after it; if Seoul was closed, US changes are combined until it reopens. Correlations are Pearson correlations of daily or weekly percentage changes; weeks are calendar weeks ending on Seoul's last session.
Pairs not shown in the first table are in the charts. The wider search used the 60 largest KOSPI and 25 largest KOSDAQ common stocks on November 11, 2026. Prices are not adjusted for dividends within the day, and results will differ over other periods.
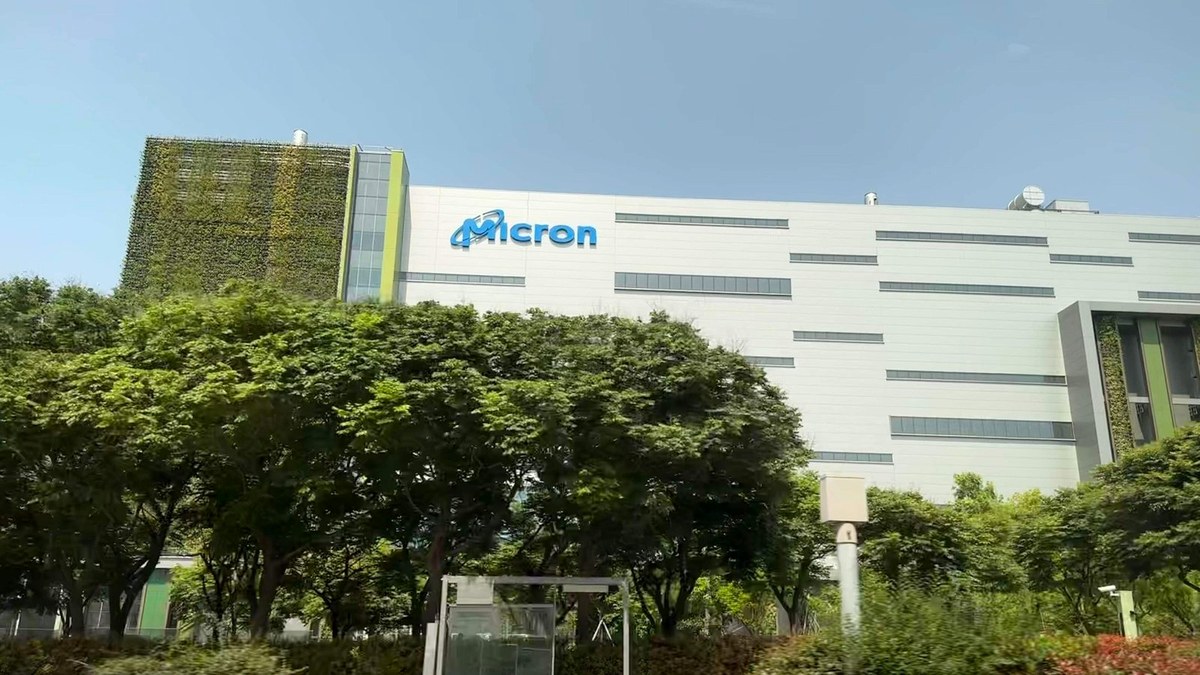
Cover photo: Micron fab in Taichung, by Thingreenline4546, CC BY-SA 4.0, via Wikimedia Commons.
For information only, not investment advice. See our full disclaimer.
Update history
- Nov 12, 2026 Reworded our take to state what we measured at the open, without claiming the overnight move is fully priced in.
- Nov 13, 2026 Added, section by section, what the results mean for someone holding these stocks: what the overnight US move lines up with, which Korean stocks tracked the US market more than their US peer, and what the weekly link means for owning both. Cut the two-week correlations and shortened the wider search.
- Nov 14, 2026 Reworded the method and the wider search around what they mean for a holder, after a reader-impression review. No numbers changed.
Corrections and changes to facts are listed here. See our editorial policy.