Samsung Electronics Earnings: Chips Were 99% of a ₩107 Trillion Quarter
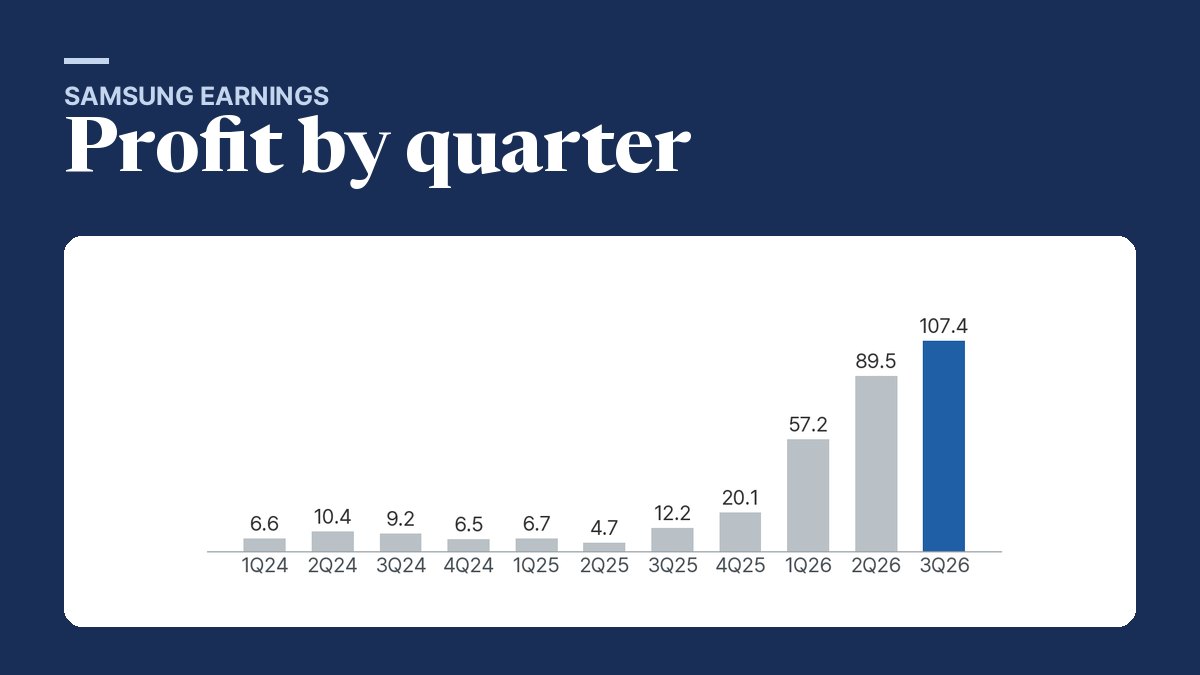
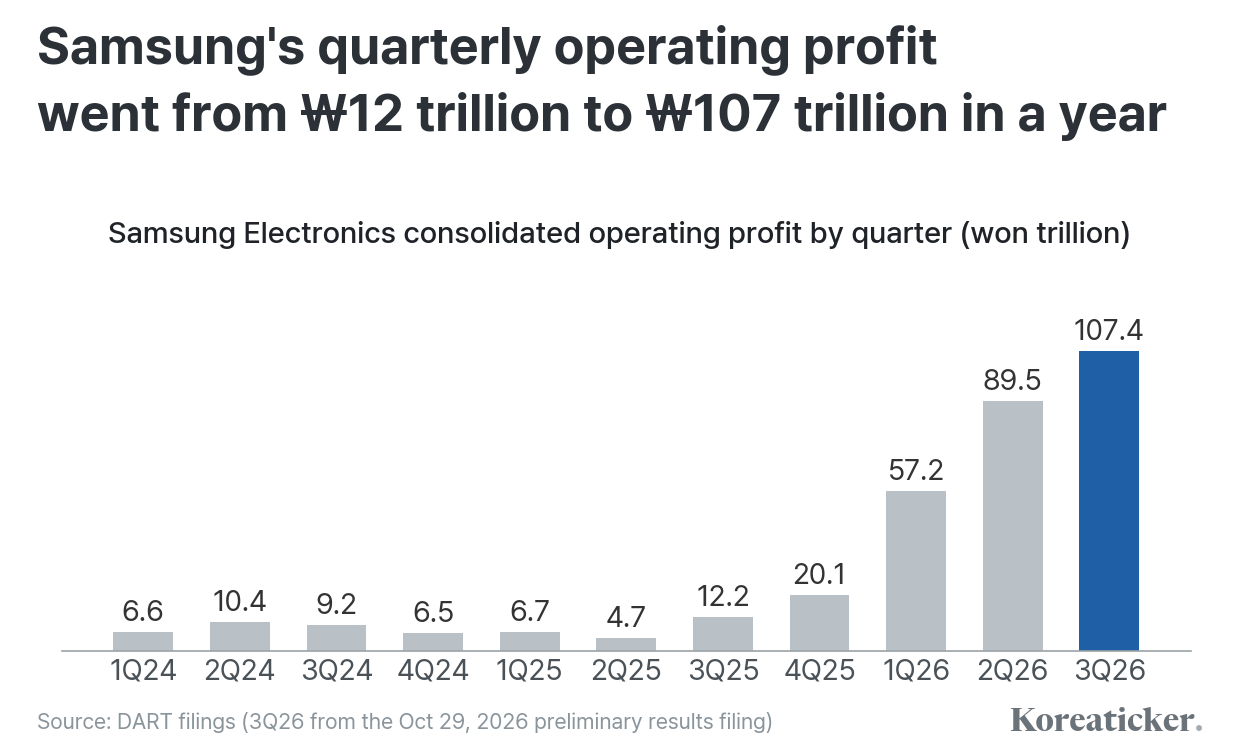
Samsung Electronics reported ₩107.4 trillion of operating profit for July to September 2026, about $80 billion. Best known in the US for Galaxy phones and TVs, the company also makes memory chips and builds chips for other firms. By November 13 its shares were 43% below their June 18 close.
The more useful question is lower down the filing: why net profit to shareholders grew about a quarter as fast as operating profit.
The short answer
- The chip division, Device Solutions (DS), which houses memory alongside contract chipmaking and other chip units, reported ₩106.5 trillion of operating profit, equal to 99% of the total. The consumer division, home to Galaxy phones, lost ₩0.8 trillion, as it did in the second quarter
- Samsung said a weaker dollar and euro cut operating profit by about ₩10 trillion from the second quarter. Profit still rose by ₩17.9 trillion
- Non-operating items went the other way: minus ₩8.9 trillion in the third quarter, after plus ₩4.9 trillion in the second
- With this quarter added, trailing net profit rose 42%, which takes the P/E to 6.4 at the November 13 close
The quarter in the filing
Preliminary figures came on October 8, and the October 29 filing, which Samsung had said would follow board approval, barely changed revenue or operating profit. What it added were the lines below operating profit, net profit among them.
| Quarter | Revenue | Operating profit | Pretax profit | Net profit to Samsung shareholders |
|---|---|---|---|---|
| 3Q25 | ₩86.1T | ₩12.2T | ₩13.5T | ₩12.0T |
| 2Q26 | ₩171.5T | ₩89.5T | ₩94.4T | ₩71.3T |
| 3Q26 | ₩195.3T | ₩107.4T | ₩98.5T | ₩75.2T |
Won trillion, consolidated. From Samsung's DART filing of October 29, 2026; third-quarter figures are not yet audited.
Operating margin reached 55%, from 52% in the second quarter. Operating profit has now risen for five quarters in a row, and the pace is slowing: up 56% in the second quarter, 20% in the third. That is still growth, from a much larger base.
One division made almost all of it
DS earned a 72% margin on ₩147.1 trillion of segment revenue, up from 70% in the second quarter.
Samsung said memory set records for quarterly revenue and operating profit, and that HBM4 sales "significantly scaled up." Money Today wrote that earnings appear to have been lifted by HBM4 sales for Nvidia's next AI platform, fully counted from this quarter, and cited TrendForce data showing ordinary DRAM contract prices up 13% to 18% from the previous quarter.
The rest of the company is a different picture. The consumer division, Device eXperience (DX), which sells Galaxy phones and TVs among other products, lost ₩0.8 trillion on ₩52.1 trillion of revenue, and Samsung pointed to rising component costs. Memory is among those components, so the price rise that lifts DS may also be adding to what DX pays.
So the consumer side is not cushioning the chip side right now. Display (₩1.1 trillion) and Harman (₩0.6 trillion) were profitable, but with the DX loss the three divisions outside chips netted ₩0.9 trillion, under 1% of the quarter's operating profit. How Samsung's HBM position compares with SK hynix and Micron is in our HBM market outlook.
A ₩10 trillion currency hit, and a gap below operating profit
Samsung sells chips in dollars and reports in won. Samsung said weaker dollar and euro rates cut third-quarter operating profit by about ₩10 trillion from the second quarter, mostly in the component businesses. In the second quarter a stronger dollar had added about ₩3.1 trillion.
A US holder feels this twice, in opposite directions. A stronger won shrinks Samsung's reported profit, and it also raises the dollar value of each won-priced share.
Further down, pretax profit includes items outside operations, such as interest income and the results of affiliates. In the third quarter those items added up to minus ₩8.9 trillion. In the second quarter they were plus ₩4.9 trillion, a swing of almost ₩14 trillion.
Was it tax? Not by much: tax took 23.7% of pretax profit in the third quarter and 24.2% in the second, so most of the gap opened above the tax line.
The swing is in the non-operating lines, and the preliminary filing does not break them down. The full quarterly report will, and Samsung had not filed it as of November 13.
This line matters more than the headline for valuation, because earnings per share and the P/E ratio are built on net profit. Samsung put third-quarter earnings at ₩11,462 per common share, which it called a record; that one quarter is about a third of the ₩32,400 per share earned over the four quarters to September.
What the share price did
| Ticker | What it does | Close, Nov 13, 2026 | Market cap, common shares | P/E, trailing | P/B |
|---|---|---|---|---|---|
| 005930 (Korea Exchange) | Memory chips, contract chipmaking, Galaxy phones, TVs | ₩206,000 | ₩1,187T (about $880B) | 6.4 | 2.39 |
P/E on net profit to shareholders for the four quarters to September; P/B on shareholders' equity at June 30.
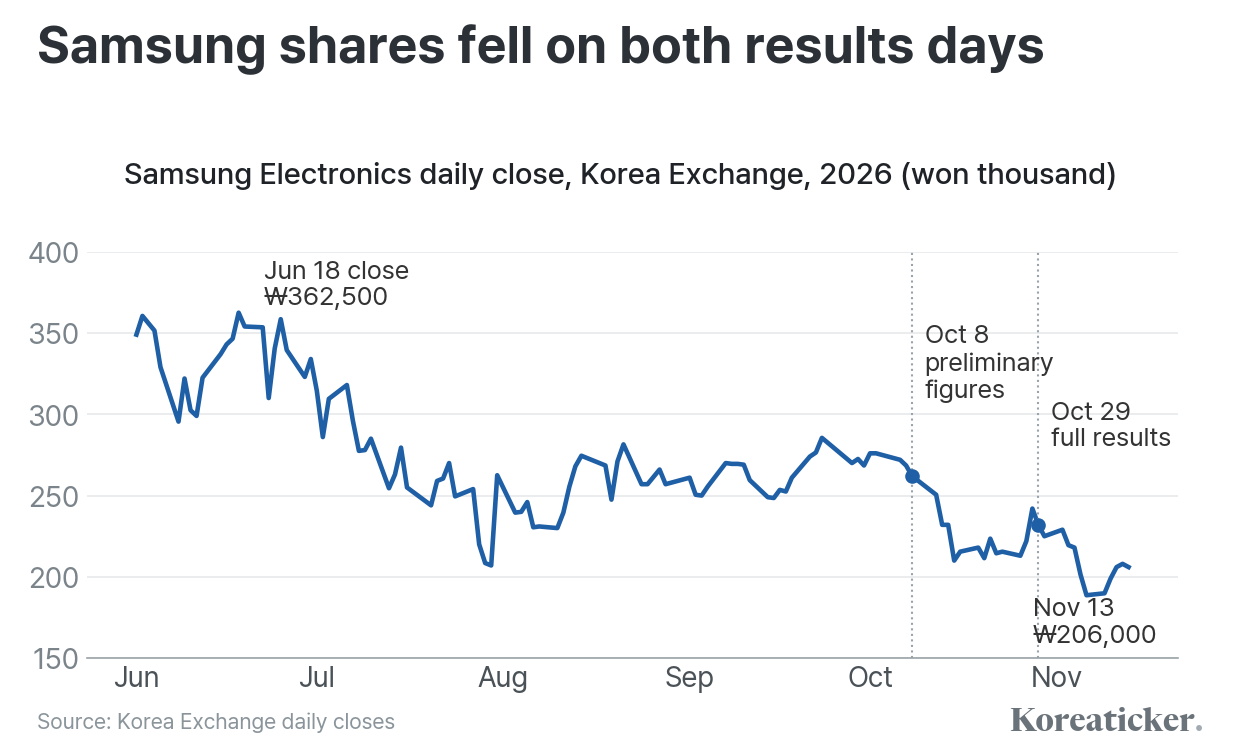
The shares closed 2.4% lower on October 8, the day of the preliminary figures, and 4.1% lower on October 29, the day of the full results.
More than half of the drop from June came before either results day. At the October 7 close, the day before the preliminary figures, the shares were ₩94,000 below their June 18 close, 60% of the whole fall to November 13.
Meanwhile the profit underneath kept growing, if more slowly. The P/E in the table uses the four quarters to September; on the four quarters to June, the same November 13 close works out to 9.0 times. Both figures use one price, so the move from 9.0 to 6.4 comes entirely from the higher profit.
Where the cash is going
Samsung declared a third-quarter dividend of ₩4,601 a share on both common and preferred stock, about $3.41, or ₩30 trillion in total. It goes out on November 27 to holders on the September 30 record date, so shares bought now do not carry it. Korea withholds tax before it reaches a US holder; see Korean dividend tax.
The company also spent ₩29 trillion on facilities in the quarter, ₩27.2 trillion of it in chips, and expects about ₩84.4 trillion for 2026. That spending sits next to a shareholder-return target for the same year of ₩90 trillion to ₩110 trillion, of which about ₩35 trillion is paid or committed.
The remaining ₩55 trillion to ₩75 trillion, which Samsung said will include a substantial share buyback and cancellation as well as dividends, is to be fixed at a board meeting in late January 2027, together with its next return policy. At the November 13 price, that remainder equals roughly 5% to 6% of the common shares' market value.
For US investors
How US investors can own Samsung Electronics
Sources and notes
- DART, Samsung Electronics, 연결재무제표기준영업(잠정)실적(공정공시), 3Q 2026 results with pretax and net profit (Oct 29, 2026). dart.fss.or.kr
- DART, Samsung Electronics, preliminary 3Q 2026 results (Oct 8, 2026) and correction filing (Oct 29, 2026). dart.fss.or.kr and dart.fss.or.kr
- Samsung Newsroom, "Samsung Electronics Announces Third Quarter 2026 Results" (Oct 29, 2026). news.samsung.com
- Samsung Semiconductor Newsroom, 삼성전자 2026년 3분기 실적 발표 (Oct 29, 2026). news.samsungsemiconductor.com
- Samsung Newsroom Korea, 삼성전자 2026년 3분기 실적 발표 (Oct 29, 2026). news.samsung.com
- Samsung Semiconductor Newsroom, 삼성전자 2026년 2분기 실적 발표 (Jul 30, 2026). news.samsungsemiconductor.com
- Money Today, "Semiconductors account for 99% of Samsung Electronics' operating profit, generating 106.5 trillion won in Q3" (Oct 29, 2026). mt.co.kr
- DART, Samsung Electronics quarterly results filings 1Q 2024 to 2Q 2026 and 2025 annual report (operating profit by quarter, 2025 net profit). dart.fss.or.kr
- DART, Samsung Electronics, 현금ㆍ현물배당결정 with record and payment dates (Oct 29, 2026). dart.fss.or.kr
- Korea Exchange daily prices for Samsung Electronics (005930), Jun 1 to Nov 13, 2026. global.krx.co.kr
Won converted at ₩1,350 per dollar, the site's fixed reference rate rather than a dated market rate. P/E and P/B: November 13 close of ₩206,000 divided by net profit to shareholders for the four quarters (or by shareholders' equity at June 30), per share of 5,764,191,903 common and 802,371,203 preferred shares, with preferred shares counted at the common price. Preferred shares trade below the common, so these are not market-cap ratios; on actual market value both would be somewhat lower (see Korean preferred shares). Fourth-quarter 2025 and first-quarter 2026 profit are derived from the annual and cumulative figures.
For information only, not investment advice. See our full disclaimer.